LEK Installation
Support Matrix | Requirements (Refer to More)
- Product and Operating System

- Product and JVM

- Supported Browsers

- Product Compatibility

Development Machine Environment
- OS: OS X EI Capitan, Version 10.11.3
- JDK: 1.7.0_71
Logstash Installation
Download Logstash 2.2.2 (logstash-2.2.2.tar.gz)
- Unzip

- Create configuration file
stevelee@SteveLee ‣ ~/Develop/logstash-2.2.2 ‣ vi myconf.conf
# The # character at the beginning of a line indicates a comment. Use
# comments to describe your configuration.
input {
stdin {
}
}
# The filter part of this file is commented out to indicate that it is
# optional.
# filter {
#
# }
output {
stdout {
}
}
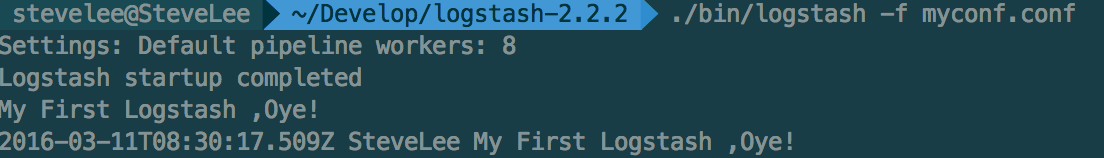
- Run
stevelee@SteveLee ‣ ~/Develop/logstash-2.2.2 ‣ ./bin/logstash -f myconf.confWhen terminal show “Logstash startup completed”, then you can type any words in terminal , such as “My First Logstash ,Oye!”, Terminal will output “2016-03-11T08:30:17.509Z SteveLee My First Logstash ,Oye!”. If you want o quit, just click Ctrl + D , logstash will be killed. (You also can use ps -ef |grep logstash to get pid, and kill that .
Logstash Architecture

Advanced
Reference (https://www.elastic.co/guide/en/logstash/current/index.html)
ElasticSearch Installation
Download Elasticsearch 2.2.0 (elasticsearch-2.2.0.tar.gz)
- Unzip

- Modify configuration file(elasticsearch.yml)
stevelee@SteveLee ‣ ~/Develop/elasticsearch-2.2.0 ‣ vi ./config/elasticsearch.yml
uncomment cluster.name, and set cluster.name: my-application-steve_dev
uncomment node.name, and set node.name: steve_node_1_dev
- Run
stevelee@SteveLee ‣ ~/Develop/elasticsearch-2.2.0 ‣ ./bin/elasticsearch &
- CRUD
a.Create an index
Input the following code to terminal:
curl -XPUT 'localhost:9200/customer?pretty'If created successfully, will show the following information:
{
"acknowledged" : true
}b.Create one recode to customer
Input the following code to terminal:
curl -XPUT 'localhost:9200/customer/external/1?pretty' -d '{
"name": "John Doe"
}'You will see the below response.
{
"_index" : "customer",
"_type" : "external",
"_id" : "1",
"_version" : 1,
"_shards" : {
"total" : 2,
"successful" : 1,
"failed" : 0
},
"created" : true
}c.Retrieve one recode from customer
curl -XGET .......d.Delete one recode from customer
curl -XDELETE .......e.Update one recode from customer
curl -XPUT .......ElasticSearch Architecture

Advanced
Plugin
⁃Marvel helps you keep a pulse on the state of your Elasticsearch deployment. As a window into your cluster, Marvel is a tool for optimizing your Elasticsearch performance and diagnosing issues quickly. (See More Marvel)⁃Head, a web front end for an Elasticsearch cluster. (See More Head)See more plugins, please visit => https://www.elastic.co/guide/en/elasticsearch/plugins/2.2/plugin-management.html

- Reference (https://www.elastic.co/guide/en/elasticsearch/reference/current/index.html)
- Other Tools
⁃VisualVM is a visual tool integrating several commandline JDK tools and lightweight profiling capabilities. Designed for both production and development time use, it further enhances the capability of monitoring and performance analysis for the Java SE platform. (See More VisualVM)
Kibana Installation
Download Kibana 4.4.2 (kibana-4.4.2-darwin-x64.tar.gz)
- Unzip

- Run (Make sure that run elasticsearch service before run kibana, & means you will run the service in background)
stevelee@SteveLee ‣ ~/Develop/kibana-4.4.1-darwin-x64 ‣ ./bin/kibana &
Stop
You need to find the pid via port, Then, you can kill the process via pid.
stevelee@SteveLee ‣ ~/Develop/kibana-4.4.1-darwin-x64 ‣ lsof -iTCP:5601 | grep LISTENYou need to find the pid via process name, Then, you can kill the process via pid. The kibana’s process name is node, not kibnan, please refer to bin/kibana script file.
stevelee@SteveLee ‣ ~/Develop/kibana-4.4.1-darwin-x64 ‣ ps -ef |grep nodeAccess Kibana http://127.0.0.1:5601

Advanced
Plugin(Sense)
Sense is a handy console for interacting with the REST API of Elasticsearch. (See More Sense)